Even a “weak” La Niña can be a master of camouflage entering the Pacific under the radar for casual onlookers, but sneakingily shaping jet streams, storm paths, and whole economies into new grooves. This year, meteorologists are keeping close tabs as cooler-than-normal water in the tropical Pacific stage a season of contrasts throughout the United States and indeed the world.
1. How La Niña Works
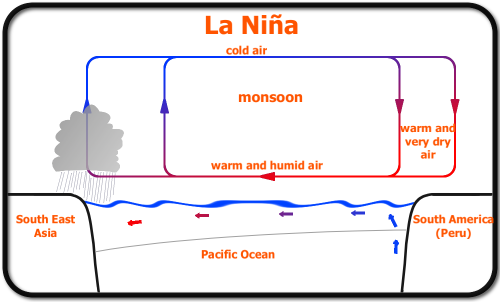
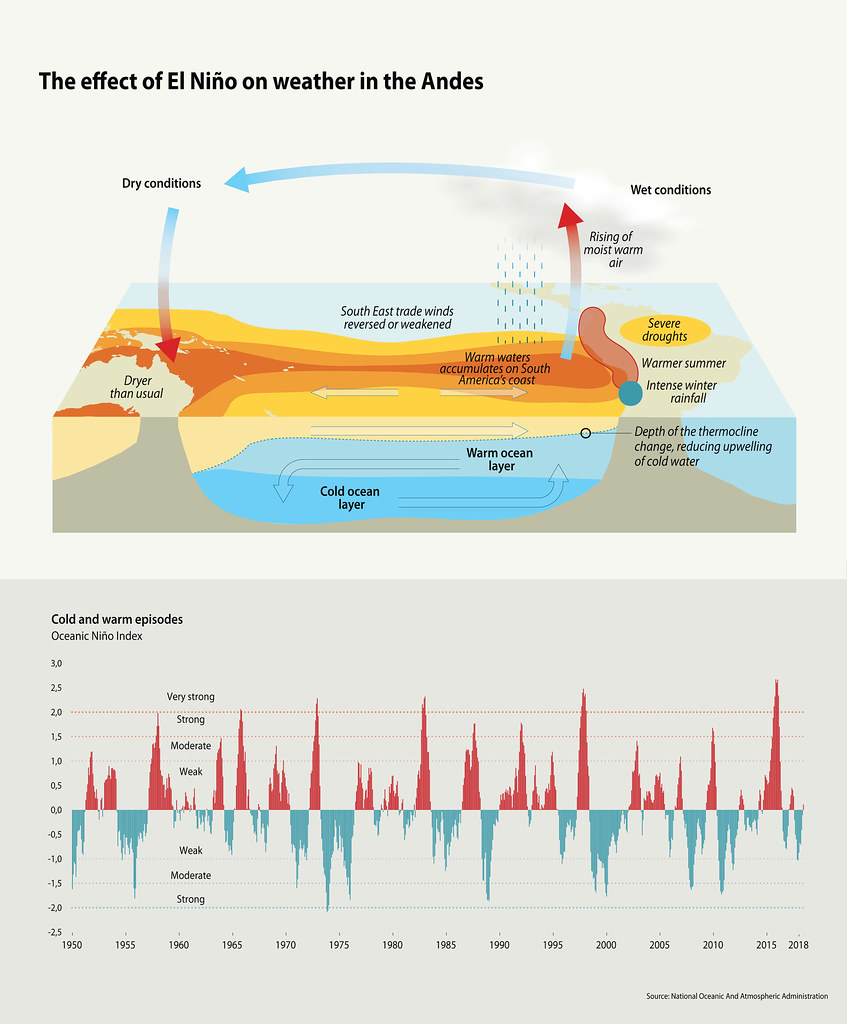
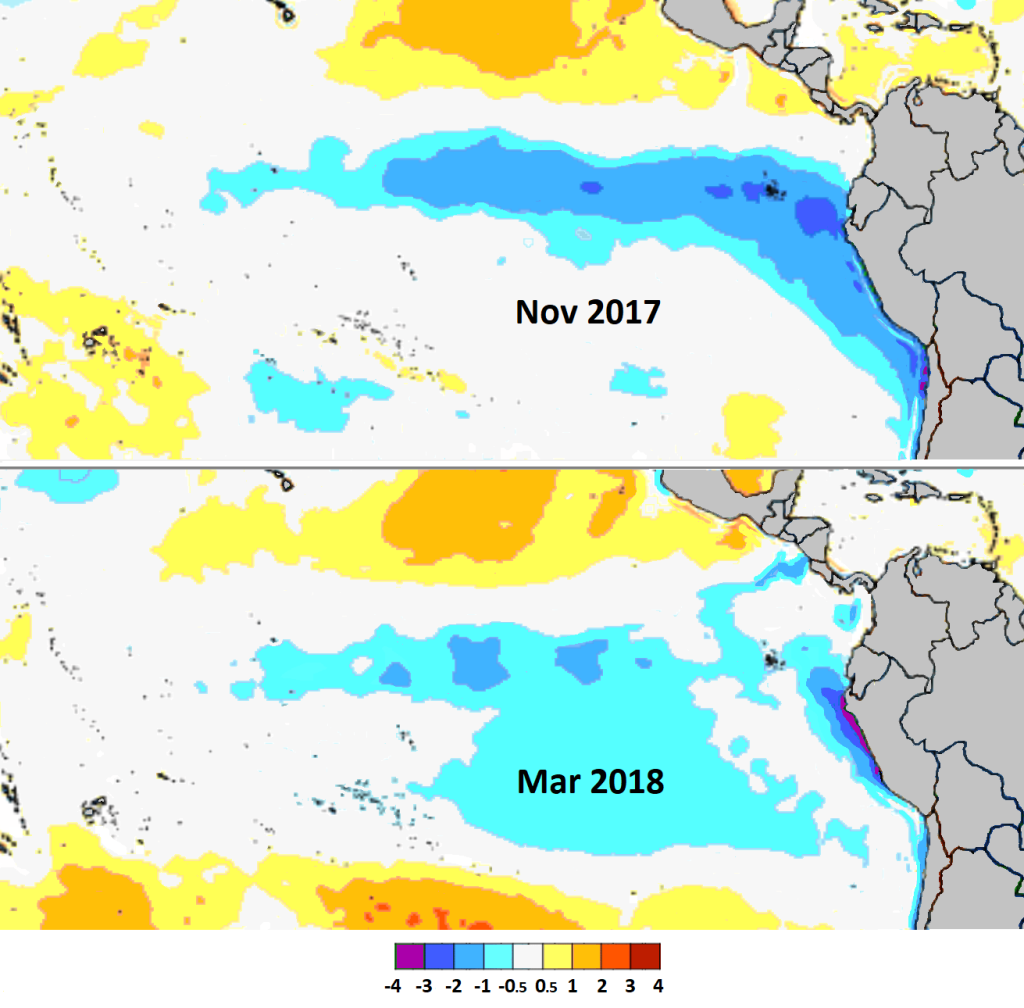
La Niña is the cold phase of the El Niño–Southern Oscillation (ENSO), characterized by more vigorous-than-usual easterly trade winds that drive warm surface water westward to Indonesia. This enables deeper, colder water to rise near South America, changing atmospheric circulation. The change of high and low pressure belts can reroute the jet stream, a rapid river of air at 18,000 feet, and subsequently affect temperature and precipitation patterns over continents.

2. Winter Weather Patterns in the U.S.
A normal La Niña winter leans the odds towards colder, snowier weather in the Pacific Northwest, Northern Plains, and Great Lakes, keeping the southernmost tier of states warm and dry. The Southeast and Mid-Atlantic tend to experience above-normal temperatures, and the Northeast is a wild card sometimes going unscathed from major snowstorms, sometimes battered by intense Nor’easters. NOAA’s latest forecast calls for wetter-than-normal conditions over the northern tier, especially the Pacific Northwest and Great Lakes, and drier-than-normal conditions from the Four Corners area through the Southeast and Gulf Coast.

3. Regional Impacts and Risks
In the Northwest, heavy mountain snowpack is a plus for water resources and winter recreation. In the South, decreased rainfall intensifies wildfire danger and extends drought, particularly in the central and southern Plains where over a quarter of the continental U.S. is in at least moderate drought. The Northeast could experience more rapid, less severe storms, maintaining snowfall at or below normal.
4. La Niña’s Impact on Hurricanes
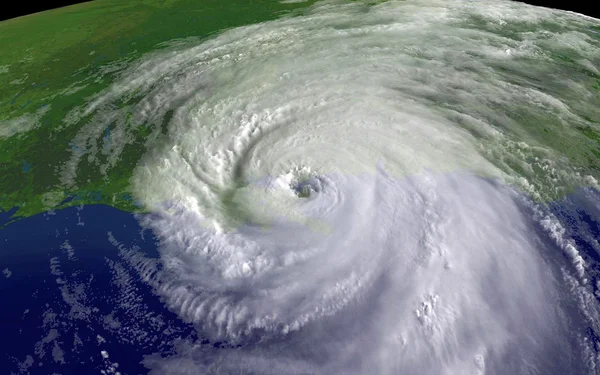
Though winter is making the headlines, La Niña’s fingerprints also reach into the Atlantic hurricane season. NOAA meteorologist Matthew Rosencrans points out that “La Niña conditions are linked to increased activity (twice the amount) in November compared with ENSO Neutral and particularly compared with Novembers with El Niño conditions.” Lower Atlantic basin wind shear permits more readily the formation of tropical systems, increasing the likelihood of late-season storms prior to the official date of November 30.

5. Forecasting Tools and Advances in Science
NOAA observes and monitors La Niña with satellites, moored and drifting buoys, sea level analysis, and expendable buoys. More recent enhancements are a $100 million expenditure on high-performance computing for weather and climate forecasting, the operational Probabilistic Winter Storm Severity Index (WSSI-P), and simplification of hazard messaging. These improvements enhance communication of potential effects and aid in decision-making by communities and industries.

6. Societal and Economic Benefits
Reliable season forecasts provide a large benefit. The World Meteorological Organization’s Celeste Saulo underlines that “seasonal forecasts of El Niño and La Niña and their related effects on our weather are a valuable climate intelligence tool… [They] are worth millions of dollars in economic savings for critical sectors such as agriculture, energy, health and transport and have saved thousands of lives when they are used to inform preparedness and response measures.” Timely predictions in agriculture assist farmers in adapting planting dates, selecting resilient crop varieties, and controlling resources to limit losses.
7. Lessons from Past Events
Historical trends indicate La Niña’s regional differences are routine but not uniform. Winter 2024–2025, for instance, delivered a record-dry winter to southern New Mexico and Arizona, above-average moisture to Alaska and the Pacific Northwest, yet surprise dryness to British Columbia. A revised index, the Relative Oceanic Niño Index (RONI), implies that even though it was deemed “weak” by conventional standards, last winter’s La Niña acted more like a mid-strength event.

8. Global Data Gaps and Investment Needs
A World Bank–WMO report puts the estimated socioeconomic benefits of enhancing surface-based observation data at more than $5 billion a year, with high return in Least Developed Countries and Small Island Developing States. Investments in ground stations and data transfer increase forecast quality, which advantages weather-sensitive sectors including agriculture, energy, and disaster risk management.

9. Agriculture and Local Forecast Value
In Zimbabwe, it was discovered that 68% of maize farmers would purchase seasonal forecasts at an average value of approximately $53.2 million annually. Access to location-specific forecasts allows farmers to make well-informed decisions about planting and allocating resources, enhancing drought and extreme weather resilience. The same applies worldwide, highlighting the use of specific climate services in preventing losses to livelihoods.
10. Other Climate Drivers
While La Niña is a strong season-long influence, other atmospheric patterns can reinforce or oppose its influence. These “teleconnections” can induce deviations from expected conditions over short intervals, so mid-season adjustments are necessary to make precise plans.
From the Pacific’s chilly seas to a farm field in the Midwest, La Niña’s influence is widespread. Its cues radiate through weather patterns, economies, and communities, demonstrating that even the slightest change in climate can define the upcoming season.