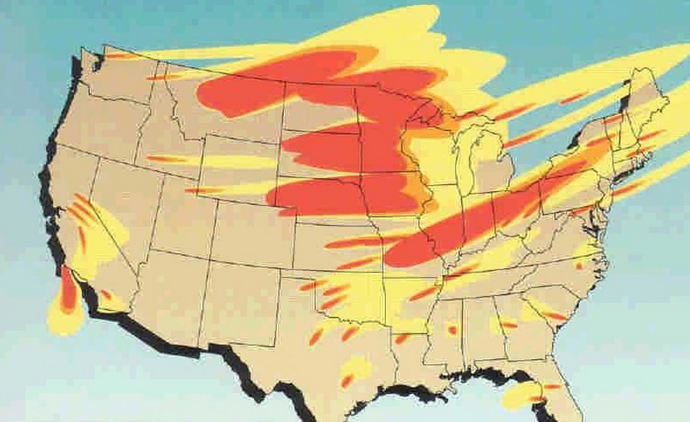
Maps built from nuclear fallout simulations tend to point to one difficult conclusion: distance from likely target zones matters. In U.S.-focused modeling, the areas with lower projected fallout exposure are generally those farthest from missile fields and major strategic sites, especially when winds carry contamination across the central corridor of the country. That does not make any place fully safe. As arms control expert John Erath told Newsweek, “Nowhere is truly ‘safe’ from fallout and other consequences like contamination of food and water supplies and prolonged radiation exposure.” Still, simulation maps and historical fallout studies do show which broad U.S. regions appear less exposed than others in average-case scenarios.
1. Northern New England
Maine, New Hampshire and Vermont appear repeatedly in lower-risk zones on maps examining fallout from hypothetical strikes on central U.S. missile fields. Their geographic advantage is straightforward: they sit far from the Great Plains silo belt and beyond the heaviest projected fallout plumes in an average-case scenario. This region also sits away from the densest cluster of historic Minuteman deployments that spread across the Plains after 1959. The broad logic behind those placements is documented by the National Park Service, which notes that Minuteman sites were dispersed over the Great Plains because of distance, warning time and lower surrounding population density.

2. Southern New England
Massachusetts, Rhode Island and Connecticut also fall into the lower-exposure band in the same simulation set. Their Atlantic position places them well east of the highest modeled fallout concentrations associated with attacks on inland missile infrastructure. That relative distance matters because fallout does not stay near the detonation point. Princeton’s Science and Global Security research on earlier U.S. atmospheric nuclear tests found contamination spread across huge areas, with radioactive material from Trinity eventually reaching 46 of the 48 contiguous states. In practical terms, maps of “lower risk” describe comparatively lighter projected exposure, not isolation from all consequences.

3. The Mid-Atlantic Corridor
New York, New Jersey, Pennsylvania, Delaware, Maryland, Virginia and the District of Columbia were included among the areas less affected in the modeled fallout pattern highlighted by Newsweek. In this framing, their placement on the eastern side of the country leaves them farther from the central target cluster than states in the upper Midwest and northern Plains. The category is still relative, not absolute. Fallout projections depend on weapon use, altitude, weather and wind movement, and broader nuclear conflict modeling shows that national effects would extend well beyond immediate blast zones. Princeton’s Plan A project described a plausible U.S.-Russia escalation with more than 90 million people dead and injured within hours, underscoring how regional maps capture only one part of a much larger disaster picture.

4. Central Appalachia
West Virginia and Kentucky stand out because they sit outside the highest projected fallout areas in the specific missile-silo strike scenario while remaining inland enough to avoid being grouped with the closest western states to the target belt. Their placement between the Midwest and East Coast creates a middle zone that appears less exposed on the map than the Plains immediately surrounding the silos. This is the kind of region that benefits from being neither too close to the missile fields nor downwind in the densest projected plume areas. In a simulation context, that combination can matter more than simple latitude or population size.

5. The Southeast Atlantic States
North Carolina, South Carolina, Georgia and Florida were also included among the less affected states in the average-case modeling. Their southeastern position places them at considerable remove from the largest inland strike concentrations used in the scenario. These states illustrate how lower fallout risk on a map often follows broad national geography rather than local preparedness. The farther a region sits from missile fields in Colorado, Wyoming, Nebraska, Montana and North Dakota, the more likely it is to appear in a lighter exposure band.

6. The Gulf South
Alabama and Mississippi appeared in the lower-risk grouping as well. They are not the farthest states from all strategic infrastructure, but they remain distant from the primary inland missile zones used in the Scientific American-based analysis discussed by Newsweek. The distinction is important because heavy fallout is not evenly distributed. Newsweek’s summary of the scenario described Nebraska, Montana and North Dakota as the worst places to be during such a strike, with nearby states such as Minnesota, Iowa and Kansas also seeing high radiation impacts.

7. The Eastern Great Lakes Edge
Ohio, Indiana and Michigan were listed among the less affected states in the average-case fallout projection. They sit closer to the central U.S. than New England or the Southeast, but still outside the highest-risk core tied to missile silo targets. That makes this a boundary region: not as insulated as the far Northeast, but not as exposed as states in and around the northern Plains. On simulation maps, those edge areas often show how quickly relative risk can change over a few hundred miles.

8. Parts of the Far West
Washington, Oregon, California, Nevada, Idaho, Utah, Arizona and New Mexico were described as less affected than the worst-hit states, though not as removed as the eastern lower-risk band. These states are geographically distant from the central missile fields, but some sit closer to western strategic installations or historical fallout pathways. That history matters. Princeton research into U.S. atmospheric nuclear testing found especially significant deposition in Nevada, Utah, Wyoming, Colorado, Arizona and Idaho after past detonations. Simulation maps therefore place much of the Far West in a lower-risk category only in comparison with the central target zone, not as a universally cleaner fallout environment.
Taken together, these maps point to a broad pattern rather than a guarantee. Regions farthest from Great Plains missile fields tend to appear in lighter fallout bands, while the upper Plains and nearby states face the harshest modeled outcomes. The larger lesson is that fallout maps describe degrees of exposure inside a national emergency with no truly unaffected zone. Even the regions that appear lower-risk on simulations remain part of a wider system shaped by radiation spread, water and food contamination, and the lasting effects of nuclear use.